 Design
Survey results infographic
Survey results infographic
Pricefrom $9
The money is reserved when you pay and released only once you accept the work.

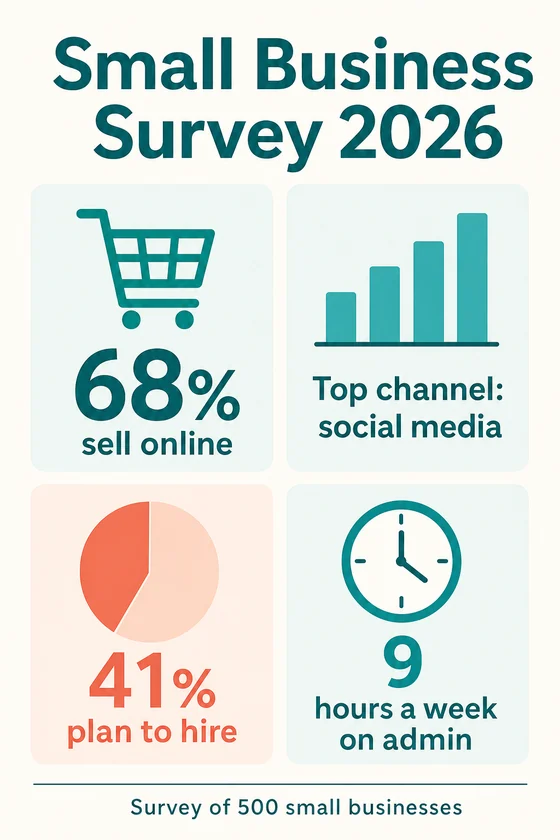
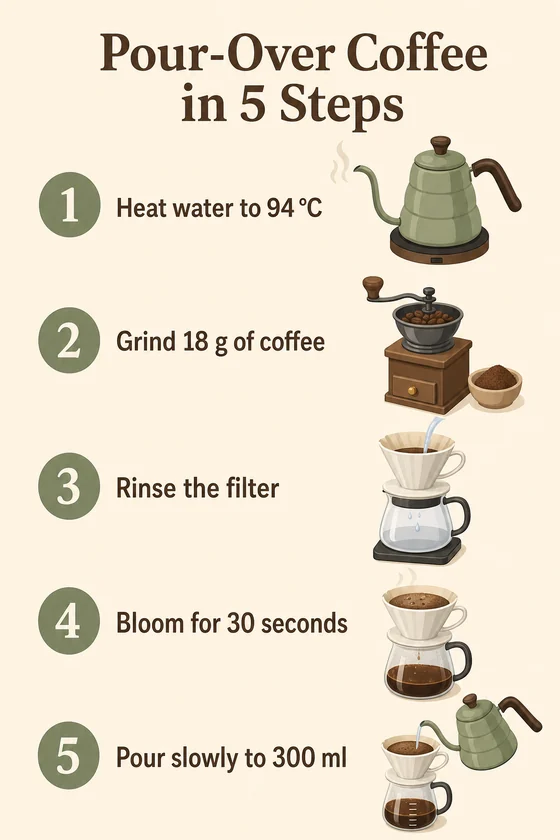
File: PNG, 1024x1536. Text and numbers come only from the client's brief; the client checks them before using the picture.
Client: a small business association and a coffee shop. Task: an infographic of survey results with the four figures they sent, and a five-step brewing guide for the counter and Pinterest.
The client and all details are made up.
An annual report is often skimmed, so a highlights infographic puts the year's key results on one page: revenue and growth, customers, team size, new markets and the main milestones. From the figures in your brief we plan a clear reading order with a bold title, number blocks, small icons and simple bar or pie charts in your brand colours, and we add no figures, forecasts or comments of our own. You get a tall 1024 x 1536 picture with short text, so check every figure and unit against your approved numbers; Latin-script languages come out best.
The report year and the title; up to about 8-10 key figures with exact values, units and the period they cover, such as revenue, growth compared with last year, customers or offices; which of them to show as a chart; your brand colours and the language. For several infographics, say which report section each one covers.
We will ask you:
| Packages | Basic1 highlights page$9 | Standard3 report infographics$19 | Premium5 report infographics$35 |
|---|---|---|---|
| Deadline | 1 day | 1 day | 2 days |
| Revisions | 1 | 2 | 3 |
| Infographics | 1 | 3 | 5 |
| Format | PNG | PNG | PNG |
| Text | a title + up to 10 short blocks | a title + up to 10 short blocks | a title + up to 10 short blocks |
| Order Basic | Order Standard | Order Premium |
You pay when you order, but the money is released only for accepted work.
No, we show the figures you send exactly as written and do not calculate, round or check them. We also give no financial or investment advice, so send growth rates and totals ready-made and compare them with the final report before you publish.
One picture holds a title and up to about 8-10 short blocks, which suits a highlights page. For finances, people and impact, take 3 or 5 infographics in one style, one per section.
Yes, at A4 size or smaller: the picture is 1024 x 1536 pixels and stays sharp at that size. It is not a print-ready file (no bleed, CMYK or vector), so it goes into your layout as a placed image.
Did not find your answer?
Design Design
 Design
 Design