 Design
Market update
Market update infographic in your agency style
Pricefrom $9
The money is reserved when you pay and released only once you accept the work.
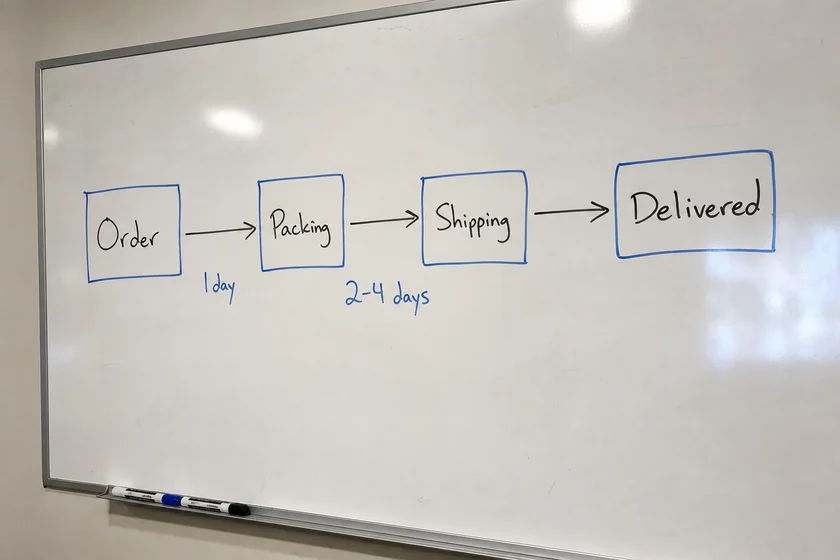
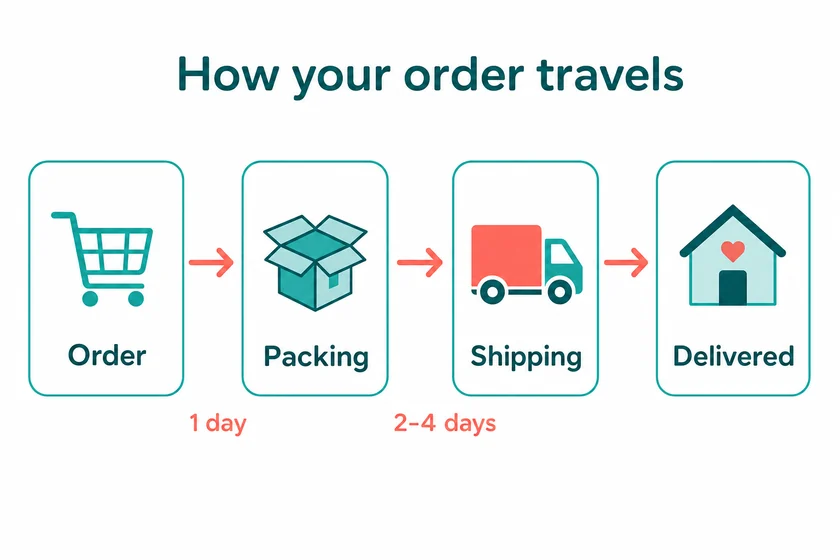
File: PNG, about 1.5 megapixels, in the shape of the upload. The steps and times are the ones on the sketch.
Client: an online store explaining delivery to customers. Task: turn a phone photo of a process sketched on the office whiteboard into a clean infographic for the delivery page.
The client and all details are made up.
A monthly report for a team or a board is read in a minute, so we turn a screenshot of your KPI spreadsheet into one picture with the month in the title, four to eight key metrics as large tiles, up or down arrows against last month or the target, and one simple trend chart. You mark which rows matter and give the exact values, and we use only those; the chart is illustrative and follows your numbers, while exact figures go on the tiles. Each PNG is made from one of your pictures, at about 1.5 megapixels in the shape of that screenshot, so a wide sheet gives a wide report; it is redrawn, so small digits can shift slightly and need your check.
Up to 5 screenshots as PNG, JPEG or WebP (no PDF) of your Excel or Google Sheets report, with the rows you need readable. List each KPI exactly as it should appear, its value, unit and change against last month or the target, and say which colour means good or bad for you.
We will ask you:
| Packages | Basic1 report$9 | Standard3 reports$19 | Premium5 reports$35 |
|---|---|---|---|
| Deadline | 1 day | 1 day | 2 days |
| Revisions | 1 | 2 | 3 |
| Pictures | 1 | 3 | 5 |
| Format | PNG | PNG | PNG |
| Text | a title + up to 10 short blocks | a title + up to 10 short blocks | a title + up to 10 short blocks |
| Order Basic | Order Standard | Order Premium |
You pay when you order, but the money is released only for accepted work.
No, it is a PNG picture, not a dashboard linked to Excel, Google Sheets or Looker Studio, and there is no editable file. Next month, upload this month's picture as the sample and type the new values in the brief, and the new report keeps the same layout.
Up to about 8 tiles, plus a title and one chart, read well; with more, the digits get small and can come out imperfect. Choose the metrics people act on, and move the rest to a second picture, for example sales and support on separate reports.
No, we use only the values you give, including percentages and arrows, and we don't recalculate, round or interpret them, or add financial advice. Write each change exactly and check every figure in the result: charts are illustrative while labels carry the exact numbers, and Latin-script languages work best.
Show only data you have the right to use and share; personal data of customers or employees doesn't belong in the picture. We don't recreate bank statements, receipts or official documents, add other brands' logos or make fake ratings or awards, and another company's report serves only as a style sample, never for its logo, brand or texts.
Did not find your answer?
Design Design
 Design
 Design